☰
Search
FIND DATA:
By Journal
|
Sites
ANALYZE DATA:
Help with
R
|
SPSS
|
Stata
|
Excel
WHAT'S NEW?
US Politics
|
IR
|
Law & Courts
🎵
FIND DATA:
By Journal
|
Sites
WHAT'S NEW?
US Politics
|
IR
|
Law & Courts
🎵
WHAT'S NEW?
US Politics
|
IR
|
Law & Courts
🎵
Streaming Excel Tutorial Videos for Descriptive Statistics
Home
›
Excel Companion
›
Tutorial Videos
› Descriptive Statistics
Watch & Learn:
Descriptive Statistics
►
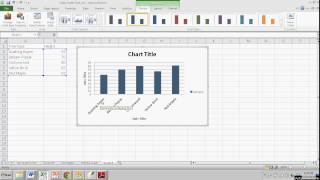
How to Create a Column Chart
i
Good emphasis on design principles (3:40)
.
►
Rank and Percentile Tools in Data Analysis ToolPak
i
How to use additional tools to describe data (1:57).
.
►
How to Use Descriptive Statistics Tool
i
Demonstrates with data on heights (2:37).
.
►
How to Show % of Total in PivotTable
i
Helps create percentages column in frequency distribution table (4:30).
.
►
Pivot Table Tutorial
i
By Kevin Stratvert (13:35)
.
►
How to Make a Map Chart
i
Demonstrates using Florida zip codes (4:33).
.
►
Sorting Worksheet Data
i
Demonstrates basics of sorting (4:30)
.
►
Learn Chart & Graph Basics for Quick Start
i
From Leila Gharani (14:09)
.
►
Making a Simple Bar Graph
i
Scott Stevens creates the graph from scratch (5:13)
.
►
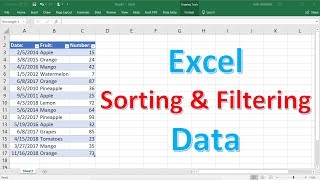
Sorting and Filtering Data
i
Starting from blank worksheet, from Organic Chemistry Tutor (13:28)
.
►
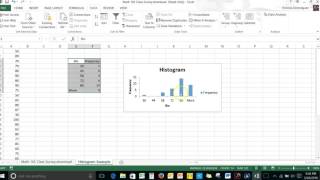
Make a Histogram Using Data Analysis ToolPak's Histogram Tool
i
By Vickie Dominguez (5:40)
.
►
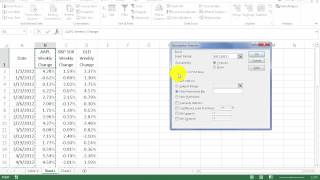
Descriptive Statistics with Excel's Data Analysis ToolPak
i
By Matt Macarty (4:24)
.