Table of Contents Click chapter title for description and links to resources
Introduction: Getting Started with SPSS
This introductory chapter helps students become familiar with SPSS, including how to navigate the interface, open datasets, and run basic commands. It sets the stage for using SPSS to analyze political data.
Students learn the fundamentals of using SPSS for data analysis. The chapter covers how to view and edit data, use value labels, and conduct basic exploratory tasks in the SPSS Data and Variable Views.
This chapter introduces descriptive statistics including means, medians, modes, and standard deviations. Students use SPSS to summarize political variables and better understand their distributions.
Students learn to create new variables and recode existing ones in SPSS. This includes computing indices, transforming variables, and preparing data for statistical analysis.
Focusing on group comparisons, this chapter teaches students to use SPSS tools such as crosstabs and means comparison to evaluate differences between political categories or groups.
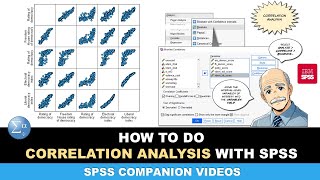
This chapter teaches students to visualize relationships using SPSS charts, including bar graphs, histograms, and scatterplots. Emphasis is placed on choosing effective graph types for political data.
Students explore the logic of experiments and surveys by simulating random assignment and sampling in SPSS. The chapter reinforces how these designs contribute to valid political inferences.
This chapter covers the logic of controlled comparisons using SPSS tools to account for rival explanations. Students learn to control for confounding variables using means and crosstab procedures.
Students learn core concepts of statistical inference, including standard error, sampling distributions, and confidence intervals. SPSS is used to compute and interpret confidence intervals for political estimates.
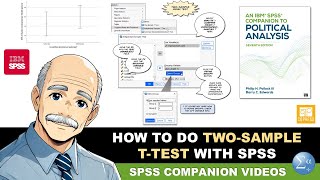
This chapter introduces hypothesis testing using one-sample and two-sample t-tests. Students use SPSS to assess whether observed differences in political data are statistically significant.
Students use SPSS to conduct chi-square tests for categorical data and ANOVA to compare means across multiple groups. The chapter focuses on interpreting results and checking assumptions.
This chapter introduces correlation and bivariate regression. Students learn to measure associations between two continuous political variables and run basic regressions in SPSS.
Students expand their skills to include multiple regression. This chapter covers model building, interpretation of coefficients, and diagnostics using SPSS for multivariate political analysis.
This chapter focuses on checking the assumptions of regression models by examining residuals. Students use SPSS plots and statistics to evaluate linearity, outliers, and homoscedasticity.
Students use SPSS to conduct logistic regression analysis for binary outcomes. The chapter emphasizes interpreting odds ratios, predicted probabilities, and model fit for political applications.
This capstone chapter walks students through designing and conducting their own political analysis using SPSS. They integrate skills from previous chapters to test hypotheses and interpret results.
The appendix provides descriptions, coding, and value labels for all variables used in the datasets, serving as a helpful reference for students working through the chapters.