☰
Search
FIND DATA:
By Journal
|
Sites
ANALYZE DATA:
Help with
R
|
SPSS
|
Stata
|
Excel
WHAT'S NEW?
US Politics
|
IR
|
Law & Courts
🎵
FIND DATA:
By Journal
|
Sites
WHAT'S NEW?
US Politics
|
IR
|
Law & Courts
🎵
WHAT'S NEW?
US Politics
|
IR
|
Law & Courts
🎵
Streaming Excel Tutorial Videos for Correlation & Bivariate Regression
Home
›
Excel Companion
›
Tutorial Videos
› Correlation & Bivariate Regression
Watch & Learn:
Correlation & Bivariate Regression
►
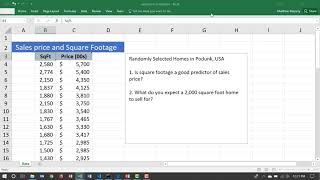
How to do Linear Regression with Data Analysis Toolpak
i
Matt Macarthy demonstrates bivariate regression with home sale data(10:40).
.
►
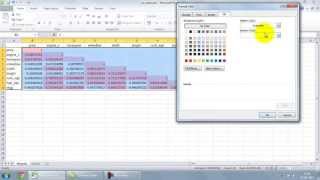
Building a Correlation Matrix with Data Analysis ToolPak
i
Demo features car data (9:09)
.
►
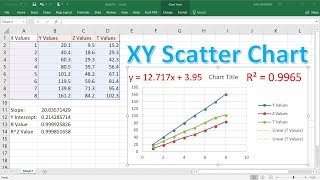
How To Make a Scatterplot with Slope, Y Intercept & R Value
i
Emphasizes Excel functions, another approach to regression analysis (13:23).
.
►
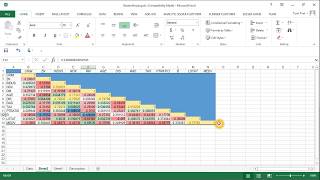
Bivariate Regression Using SLOPE and INTERCEPT Functions
i
David Houston demonstrates with global life expectancy data (13:17).
.
►
Creating Correlation Table Using Data Analysis Tools
i
Example based on Boston housing data, shows how to color-code results (9:39).
.