☰
Search
FIND DATA:
By Journal
|
Sites
ANALYZE DATA:
Help with
R
|
SPSS
|
Stata
|
Excel
WHAT'S NEW?
US Politics
|
IR
|
Law & Courts
🎵
FIND DATA:
By Journal
|
Sites
WHAT'S NEW?
US Politics
|
IR
|
Law & Courts
🎵
WHAT'S NEW?
US Politics
|
IR
|
Law & Courts
🎵
Streaming Excel Tutorial Videos for Making Controlled Comparisons
Home
›
Excel Companion
›
Tutorial Videos
› Making Controlled Comparisons
Watch & Learn:
Making Controlled Comparisons
►
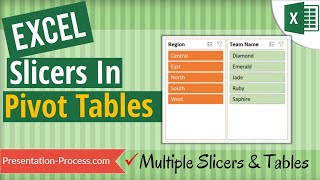
Adding Slicers to PivotTable
i
Demonstrated with business data (14:01).
.
►
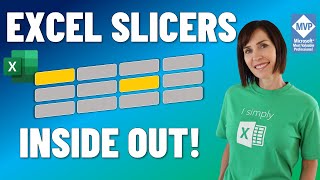
Excel Slicers, Inside Out
i
Mynda Treacy shows how to set-up and use slicers (13:04).
.
►
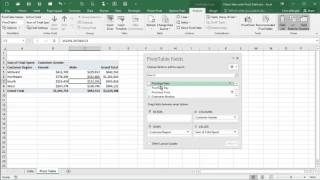
Pivot Table Fields Pane Options
i
Good overview of Pivot Table options (4:21).
.
►
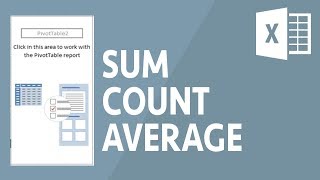
Using PivotTable to Create Controlled Mean Comparison Table
i
Example shows repair time (DV) by technician, controlling for job type (4:01).
.