☰
Search
FIND DATA:
By Journal
|
Sites
ANALYZE DATA:
Help with
R
|
SPSS
|
Stata
|
Excel
WHAT'S NEW?
US Politics
|
IR
|
Law & Courts
🎵
FIND DATA:
By Journal
|
Sites
WHAT'S NEW?
US Politics
|
IR
|
Law & Courts
🎵
WHAT'S NEW?
US Politics
|
IR
|
Law & Courts
🎵
Streaming Excel Tutorial Videos for Making Comparisons
Home
›
Excel Companion
›
Tutorial Videos
› Making Comparisons
Watch & Learn:
Making Comparisons
►
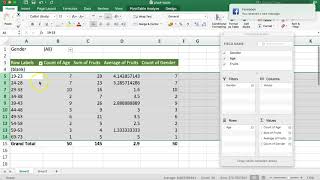
Using Count, Average and Sum in Pivot Tables
i
Useful for creating mean comparison tables (8:16).
.
►
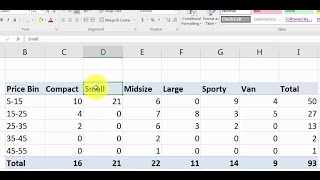
How to Make Cross-Tabulation
i
Uses PivotTable to make cross-table with car data (12:02).
.
►
Using SUM, COUNT and AVERAGE in PivotTables
i
Skills needed to make create mean comparison tables (9:51).
.
►
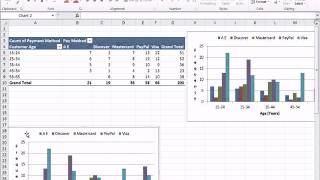
Cross Tabulation With Frequencies and Percentages
i
Shows how to calculate values and format PivotTable (15:12).
.
►
How to Group, Ungroup, and Remove PivotTable Rows
i
Useful for making comparisons with interval-level independent variable (3:23).
.
►
Calculating Means and Standard Deviations in PivotTable
i
Useful for creating mean comparison tables (7:34).
.
►
Excel PivotTables Made Easy
i
Demonstrates PivotTables with sales data (DV) and addresses common problems (13:17).
.
►
Excel Pivot Tables Explained
i
Leila Gharani uses PivotTables to summarize sales data by other variables, like sales by product (13:21).
.