☰
Search
FIND DATA:
By Journal
|
Sites
ANALYZE DATA:
Help with
R
|
SPSS
|
Stata
|
Excel
WHAT'S NEW?
US Politics
|
IR
|
Law & Courts
🎵
FIND DATA:
By Journal
|
Sites
WHAT'S NEW?
US Politics
|
IR
|
Law & Courts
🎵
WHAT'S NEW?
US Politics
|
IR
|
Law & Courts
🎵
Streaming R Tutorial Videos and Online Demos for Graphing Relationships and Describing Patterns
Home
›
R Companion
›
Tutorial Videos & Demos
› Graphing Relationships and Describing Patterns
WATCH & LEARN:
Graphing Relationships and Describing Patterns
►
Base Package Plotting Functions
i
From Roger Peng (6:56)
.
►
Stacked and Grouped Bar Charts and Mosaic Plots
i
From Mike Marin (3:52)
.
►
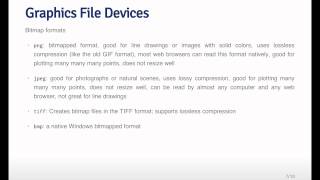
Graphics File Devices
i
Discusses different image file types, from Roger Peng (7:30)
.
►
Boxplots and Grouped Boxplots
i
From Mike Marin (4:14)
.
►
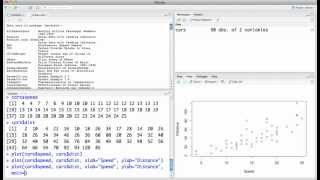
How to Make Scatterplots
i
From Mike Marin (4:43)
.
►
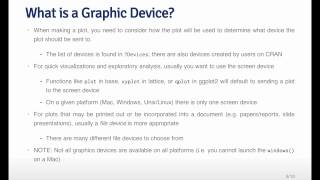
Graphics Devices in R
i
A closer look at how R creates plots, from Roger Peng (5:33)
.
►
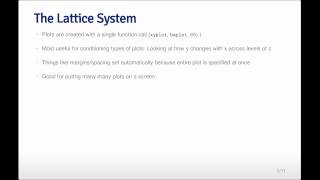
Plotting Systems
i
Overview of base plotting system and other systems by Roger Peng (9:34)
.
►
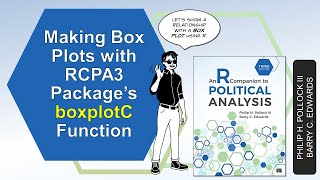
Making Box Plots With RCPA3's BoxplotC Function
i
Video tutorial & demo by Barry Edwards for
R Companion to Political Analysis, 3rd Ed.
(13:57)
.
►
Introduction to Plotting
i
From Andrew Jahn (5:01)
.
Strip Chart of Unionization by Region Demo.
i
Create a strip chart to visualize relationship using formula syntax.
.
►
Plotting Means With RCPA3's CompmeansC Function
i
Video tutorial & demo by Barry Edwards for
R Companion to Political Analysis, 3rd Ed.
(19:34)
.
►
Plots for Cross-Tabulations With RCPA3's CrosstabC Function
i
Video tutorial & demo by Barry Edwards for
R Companion to Political Analysis, 3rd Ed.
(8:27)
.
►
Exploratory Graphs
i
From Roger Peng (5:12)
.