☰
Search
FIND DATA:
By Journal
|
Sites
ANALYZE DATA:
Help with
R
|
SPSS
|
Stata
|
Excel
WHAT'S NEW?
US Politics
|
IR
|
Law & Courts
🎵
FIND DATA:
By Journal
|
Sites
WHAT'S NEW?
US Politics
|
IR
|
Law & Courts
🎵
WHAT'S NEW?
US Politics
|
IR
|
Law & Courts
🎵
Streaming R Tutorial Videos and Online Demos for Descriptive Statistics
Home
›
R Companion
›
Tutorial Videos & Demos
› Descriptive Statistics
WATCH & LEARN:
Descriptive Statistics
►
How to Use RCPA3's describeC Function for Descriptive Statistics
i
Easy way to generate tables of descriptive statistics, from Barry Edwards (16:01)
.
►
Exploratory Graphs
i
From Roger Peng (9:28)
.
Descriptive Statistics for Ordinal-Level Variable Demo.
i
Analyzing opinions on immigration policy with poliscidata package
.
►
How to Use RCPA3's freqC Function for Frequency Distribution Tables and Bar Charts
i
Simple way to create frequency distribution tables and bar charts for nominal and ordinal-level variables, from Barry Edwards (14:23)
.
►
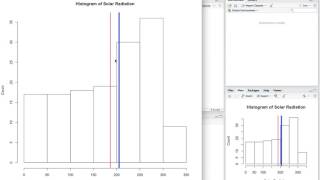
How to Use RCPA3's histC Function to Generate Histograms
i
Quick and easy way to generate histograms for interval-level variables, from Barry Edwards (10:50)
.
►
How to Make Histograms
i
From thatRnerd (7:11)
.
►
Generating Descriptive Statistics
i
From David Caughlin (25:50)
.
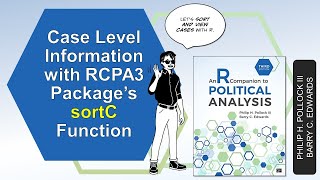
►
Sort and View Case-Level Information With the RCPA3's SortC Function
i
Video tutorial & demo by Barry Edwards for
R Companion to Political Analysis, 3rd Ed.
(11:11)
.
►
Arranging (Sorting) Data
i
From David Caughlin (16:32)
.
►
Basic Summary Statistics
i
From LawrenceStats (5:16)
.
Descriptive Statistics for Nominal-Level Variable Demo.
i
Create a frequency distribution table, bar chart, and identify the mode of a nominal-level variable (zodiac signs).
.
Descriptive Statistics for Interval-Level Variable Demo.
i
Analyzing age of General Social Survey respondents.
.